How to Link Excel Charts to PowerPoint for Instant Updates
Linking Excel charts to PowerPoint allows you to incorporate real-time data into your presentations. This feature ensures that your charts and graphs are always up-to-date, reflecting the latest information and trends.

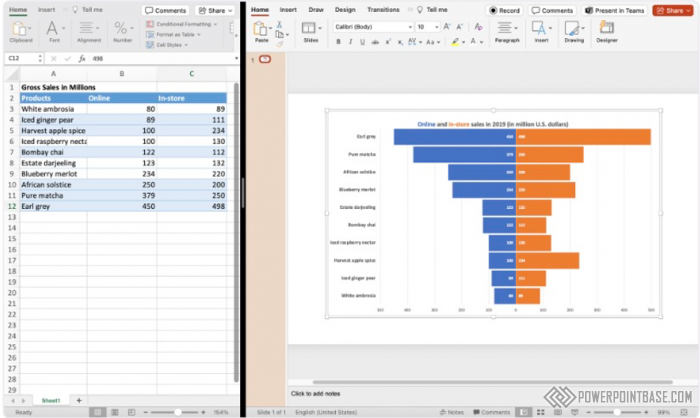
To link an Excel chart, copy the chart from Excel, go to PowerPoint, and use the "Paste Special" option to paste it as a link. This will create a dynamic link between the Excel file and your PowerPoint presentation. Any updates made to the Excel chart will be automatically reflected in the PowerPoint slide.
Linked Excel charts are essential for presentations that require real-time data updates. They ensure that your information is always current, making your presentations more accurate and reliable. This feature is particularly useful for business, financial, and academic presentations that rely on up-to-date data.
The primary benefit of linked Excel charts is the real-time updates they provide. This ensures that your data is always accurate and reflects the latest information. Additionally, linking charts saves time by eliminating the need to manually update your PowerPoint slides. By using linked Excel charts, you can create dynamic and data-driven presentations that are always up-to-date.
ѕоделитесь с друзь€ми: